HOME
SOFTWARE
--- CFDStudio
--- ANSWER
Applications
Examples
ANSWER Express
Publications
Users
Price List
Request Demo
ANSWER Tutorials
ANSWER Manual
--- PORFLOW
--- TIDAL
--- RADM
--- TOOLS
DOWNLOADS
APPLICATIONS
CONSULTING
STORE
COMPANY
CONTACT
FAQ
 

ACRi -- Analytic & Computational Research, Inc.

1 2 3 4 5 6 7

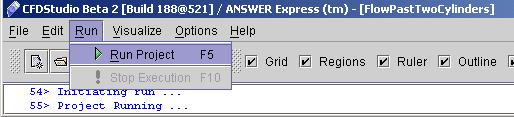
59) Go to Menu option Run >> Run Project or Press F5 (fig 4.7).

Fig - 4.7: Run Menu

It will start a Runtime console window as shown in fig 4.8

Fig - 4.8: Runtime Console.

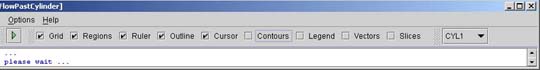
60)Once the run is finished. Go to options available on tool bar as Grid, Regions, Contours, Slices etc. or select Visualize menu to follow Contours specifications as shown in fig 4.9

Fig - 4.9: Menu bar

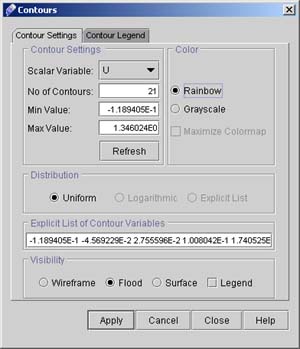
61)Click "Contours" and uncheck Grid. A dialog window will appear. (See fig 5.0). From this window you can choose different option for contour plot of dependent variables.

Fig 5.0 Window for contour plot.

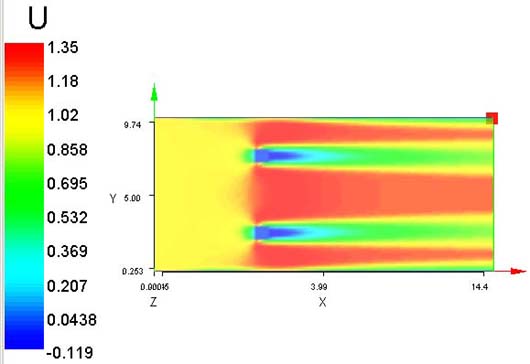
62) Choose scalar variable "U" and click on flood. The resulting plot with Legend option is shown in Fig.5.1

Fig - 5.1: Flood Contours plot of Stream wise velocity (U)

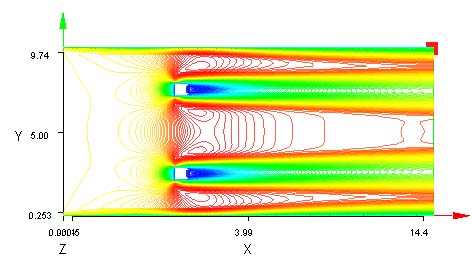
63) Similarly click "Surface" on window for "Contours" (fig. 5.0) for surface contour plot of U. Increase the number of contours to 150. Resulting plot will be as shown in fig 5.2. Click upon Close Button to close this Dialog box.

Fig - 5.2: Surface contours of U

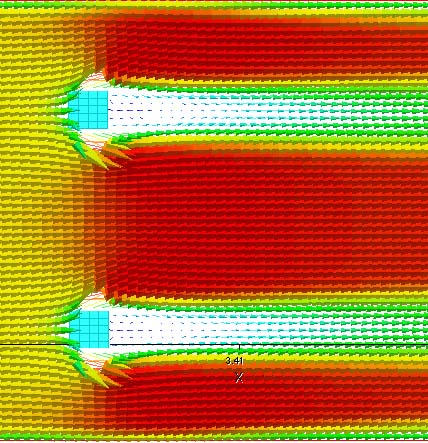
64) In the tool bar as in fig 4.9 check Vectors and uncheck Contours. Resulting vector plot is shown in fig 5.3

Fig - 5.3: Vector plot of flow.

This concludes the structured problem of the tutorial for CFDStudio/ANSWER™.

1 2 3 4 5 6 7


Back to CFDStudio/ANSWER Tutorials Page


Related Links:

ANSWER Applications
ANSWER Examples
ANSWER Express
ANSWER Publications
ANSWER Users
ANSWER Price List
Request CFDStudio/ANSWER Demo
CFDStudio/ANSWER Tutorials
ANSWER Manual


HOME | SOFTWARE | DOWNLOADS | APPLICATIONS | CONSULTING | STORE | COMPANY

© 2015 ACRi