HOME
SOFTWARE
--- CFDStudio
--- ANSWER
Applications
Examples
ANSWER Express
Publications
Users
Price List
Request Demo
ANSWER Tutorials
ANSWER Manual
--- PORFLOW
--- TIDAL
--- RADM
--- TOOLS
DOWNLOADS
APPLICATIONS
CONSULTING
STORE
COMPANY
CONTACT
FAQ
 

ACRi -- Analytic & Computational Research, Inc.

1 2 3 4 5 6 7

55) When run will be completed it will ask to save the files as shown in fig 4.4 Click "Yes".

Fig - 4.4: Successful Run

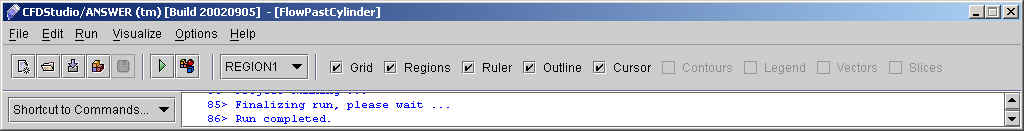
56) Once the run is finished. Go to option available on tool bar as shown in Fig 4.5

Fig - 4.5: Tool bar

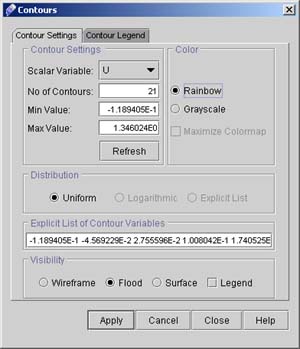
57) Click "Contours" and uncheck "Grid". A dialog window will appear (See fig 4.6). From this window you can choose different option for contour plot of dependent variables.

Fig - 4.6: Window for contour plot.

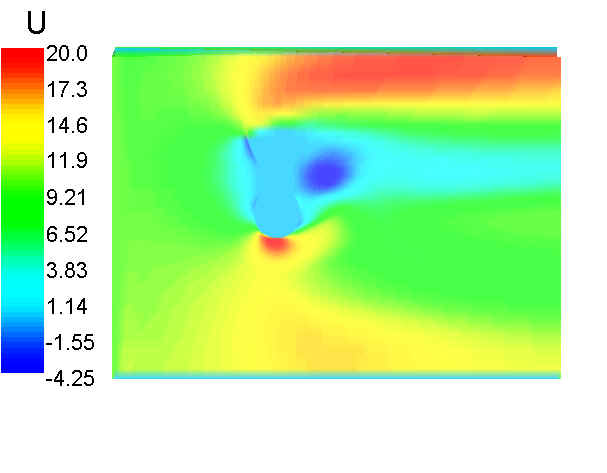
58) Choose scalar variable "U" and click on flood. The resulting plot is shown in Fig.4.7

Fig - 4.7: Flood Contours plot of Streamwise velocity (U)

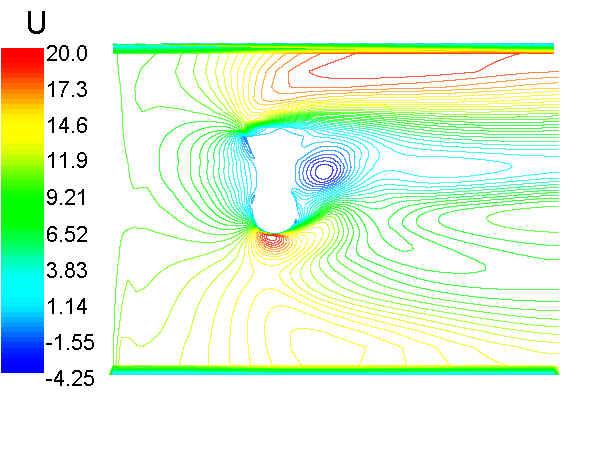
59) Similarly click "Surface" on window for "Contours" for surface contour plot of U. Increase the number of contours to 50. Resulting plot will be as shown in fig 4.8.

Fig - 4.8: Surface contours of U

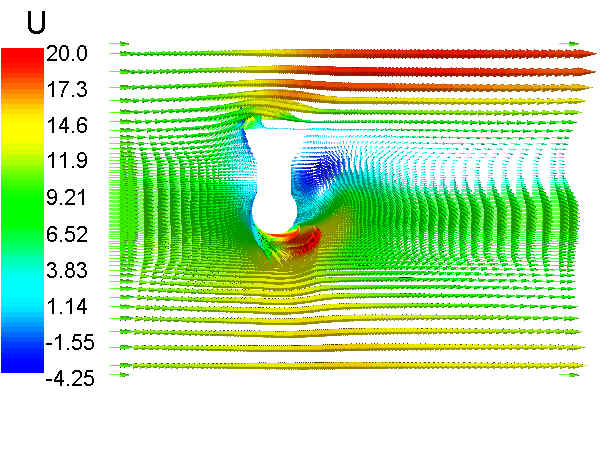
60) In the tool bar (Fig 4.9) check Vectors and uncheck Contours.

Fig - 4.9: Vector plot of flow.

This concludes the structured problem of the tutorial for the new interface of ANSWER-5.5.

1 2 3 4 5 6 7


Back to CFDStudio/ANSWER Tutorials Page


Related Links:

ANSWER Applications
ANSWER Examples
ANSWER Express
ANSWER Publications
ANSWER Users
ANSWER Price List
Request CFDStudio/ANSWER Demo
CFDStudio/ANSWER Tutorials
ANSWER Manual


HOME | SOFTWARE | DOWNLOADS | APPLICATIONS | CONSULTING | STORE | COMPANY

© 2015 ACRi